;%20}%20%3c/style%3e%3clinearGradient%20id='linear-gradient'%20x1='2.99'%20y1='29.35'%20x2='127.75'%20y2='101.39'%20gradientUnits='userSpaceOnUse'%3e%3cstop%20offset='0'%20stop-color='%23f2b347'%20/%3e%3cstop%20offset='.5'%20stop-color='%23ca5a8b'%20/%3e%3cstop%20offset='1'%20stop-color='%236654f5'%20/%3e%3c/linearGradient%3e%3c/defs%3e%3cg%20id='Layer_1-2'%20data-name='Layer%201'%3e%3cpath%20class='cls-1'%20d='M83.56,0H47.18C21.12,0,0,21.12,0,47.18v36.38c0,26.06,21.12,47.18,47.18,47.18h36.38c26.06,0,47.18-21.12,47.18-47.18V47.18C130.74,21.12,109.62,0,83.56,0ZM20.62,48.64c2.84-2.84,6.59-4.23,10.32-4.17,3.82,.07,7.55-1.1,10.25-3.8l.56-.56c2.7-2.7,3.86-6.43,3.8-10.25-.07-3.73,1.32-7.47,4.17-10.32,6.18-6.18,16.66-5.48,21.88,2.11,3.18,4.62,3.27,10.96,.19,15.64-3.02,4.6-7.92,6.78-12.72,6.54-3.51-.17-6.95,.99-9.43,3.48l-1.24,1.24c-2.48,2.48-3.65,5.92-3.48,9.43,.24,4.8-1.94,9.7-6.54,12.72-4.68,3.08-11.03,2.99-15.64-.19-7.6-5.23-8.29-15.7-2.11-21.88Zm33.7,34.25c-2.7,2.7-3.86,6.43-3.8,10.25,.07,3.73-1.32,7.47-4.17,10.32-6.18,6.18-16.66,5.48-21.88-2.11-3.18-4.62-3.27-10.96-.19-15.64,3.02-4.6,7.92-6.78,12.72-6.54,3.51,.17,6.94-.99,9.43-3.48l1.24-1.24c2.48-2.48,3.65-5.92,3.48-9.43-.24-4.8,1.94-9.7,6.54-12.72,4.68-3.08,11.03-2.99,15.64,.19,7.6,5.23,8.3,15.7,2.11,21.88-2.84,2.84-6.59,4.23-10.32,4.17-3.82-.07-7.55,1.1-10.25,3.8l-.56,.56Zm55.8-2.93c-2.96,2.96-6.91,4.35-10.79,4.15-3.51-.17-6.96,.99-9.44,3.48l-1.23,1.23c-2.49,2.49-3.65,5.93-3.48,9.44,.19,3.88-1.19,7.82-4.15,10.79-6.18,6.18-16.66,5.48-21.88-2.11-3.18-4.62-3.27-10.96-.19-15.64,3.02-4.6,7.92-6.78,12.72-6.54,3.51,.17,6.95-.99,9.43-3.48l1.24-1.24c2.48-2.48,3.65-5.92,3.48-9.43-.24-4.8,1.94-9.69,6.54-12.72,4.68-3.08,11.03-2.99,15.64,.19,7.6,5.23,8.3,15.7,2.11,21.88Z'%20/%3e%3c/g%3e%3c/svg%3e)


, history mode: On
> Your generated output will be shown here.
Creators
Visualizers
About SAS
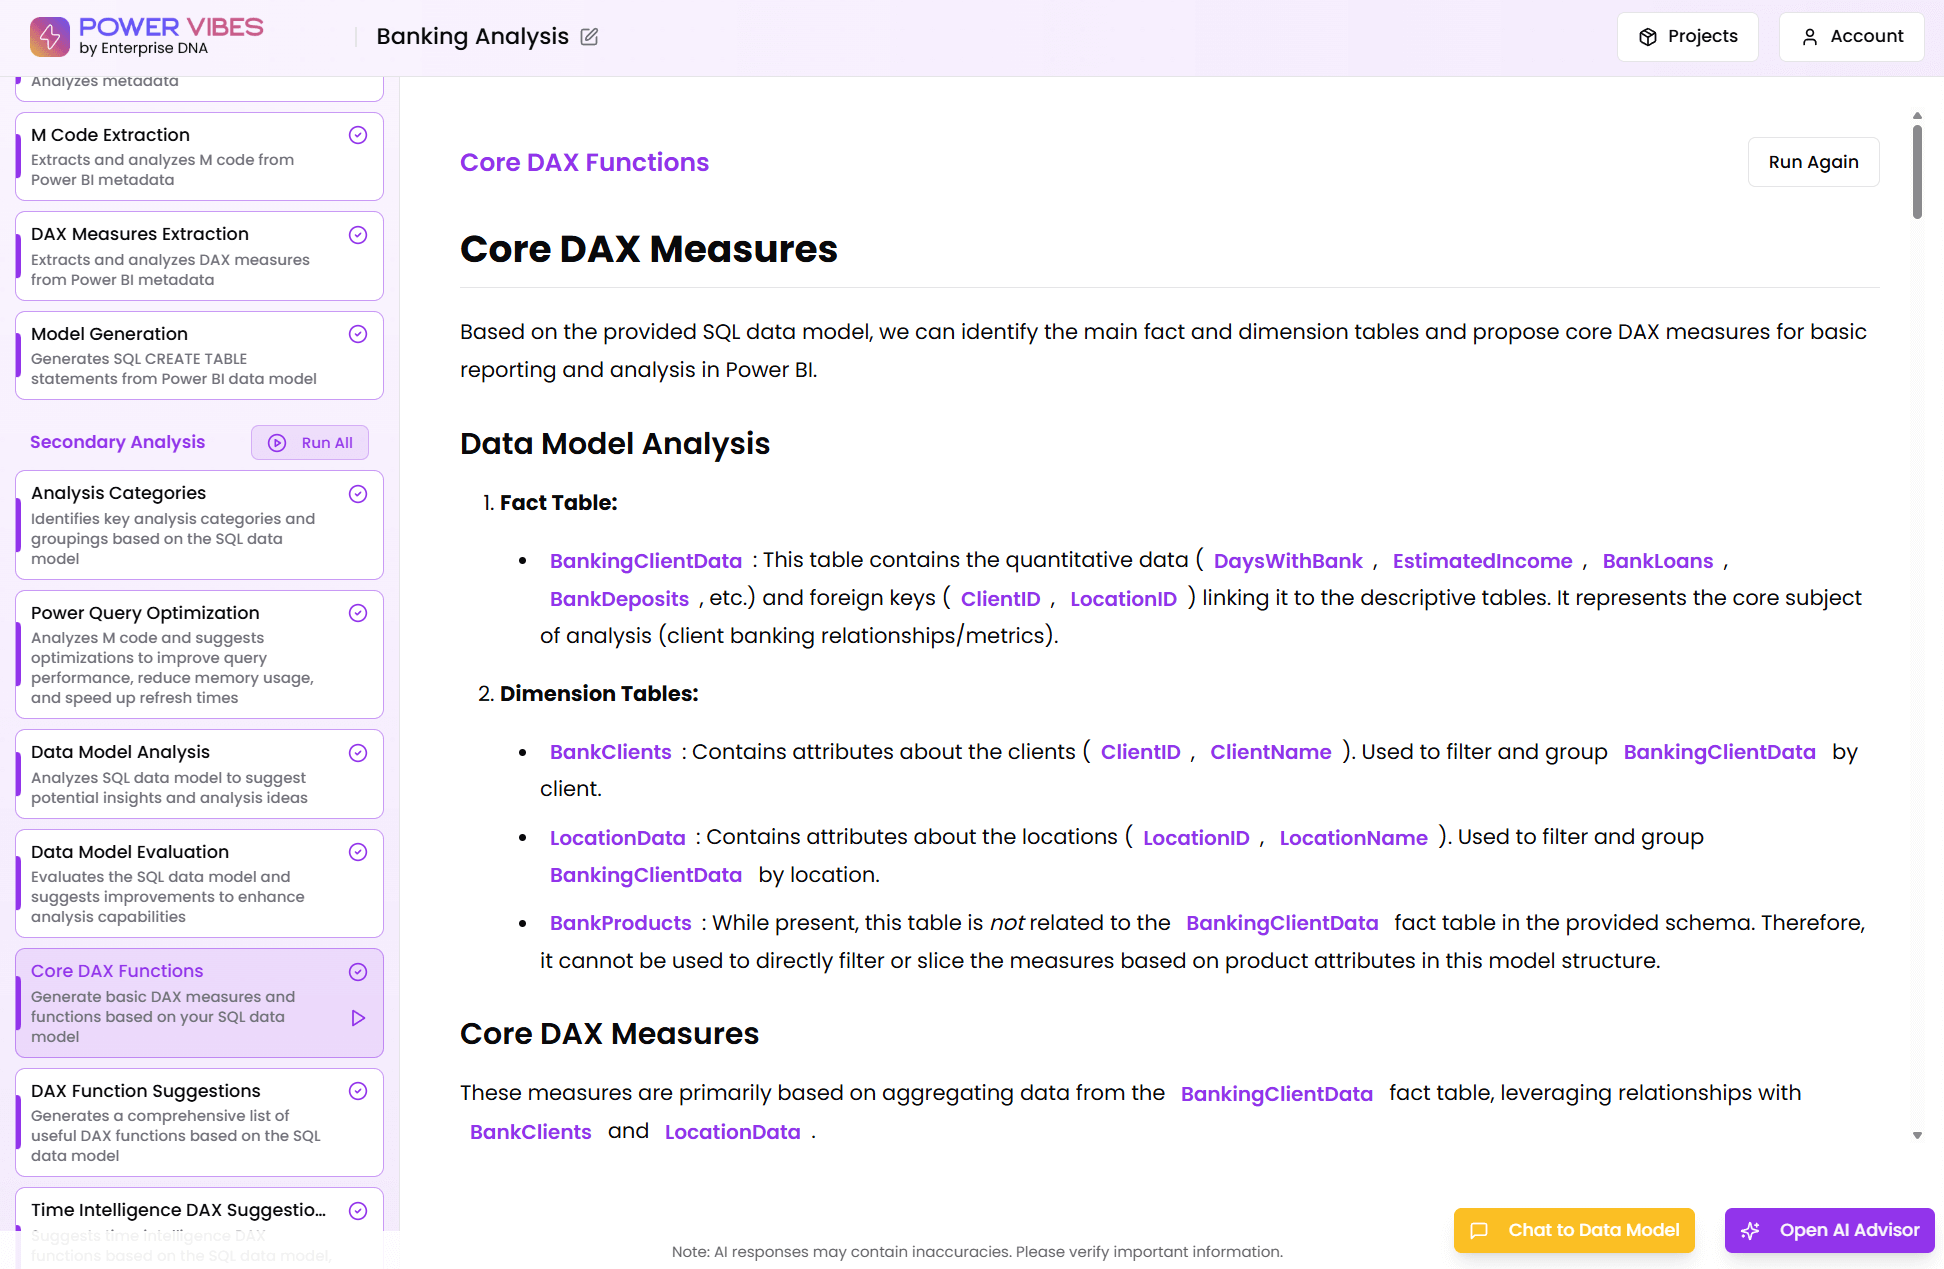
SAS (Statistical Analysis System) is a software suite used for advanced analytics, business intelligence, and data management. Widely employed in various industries, SAS provides a comprehensive set of tools for data analysis, statistical modeling, and reporting, making it a valuable asset for organizations seeking to derive insights from their data.
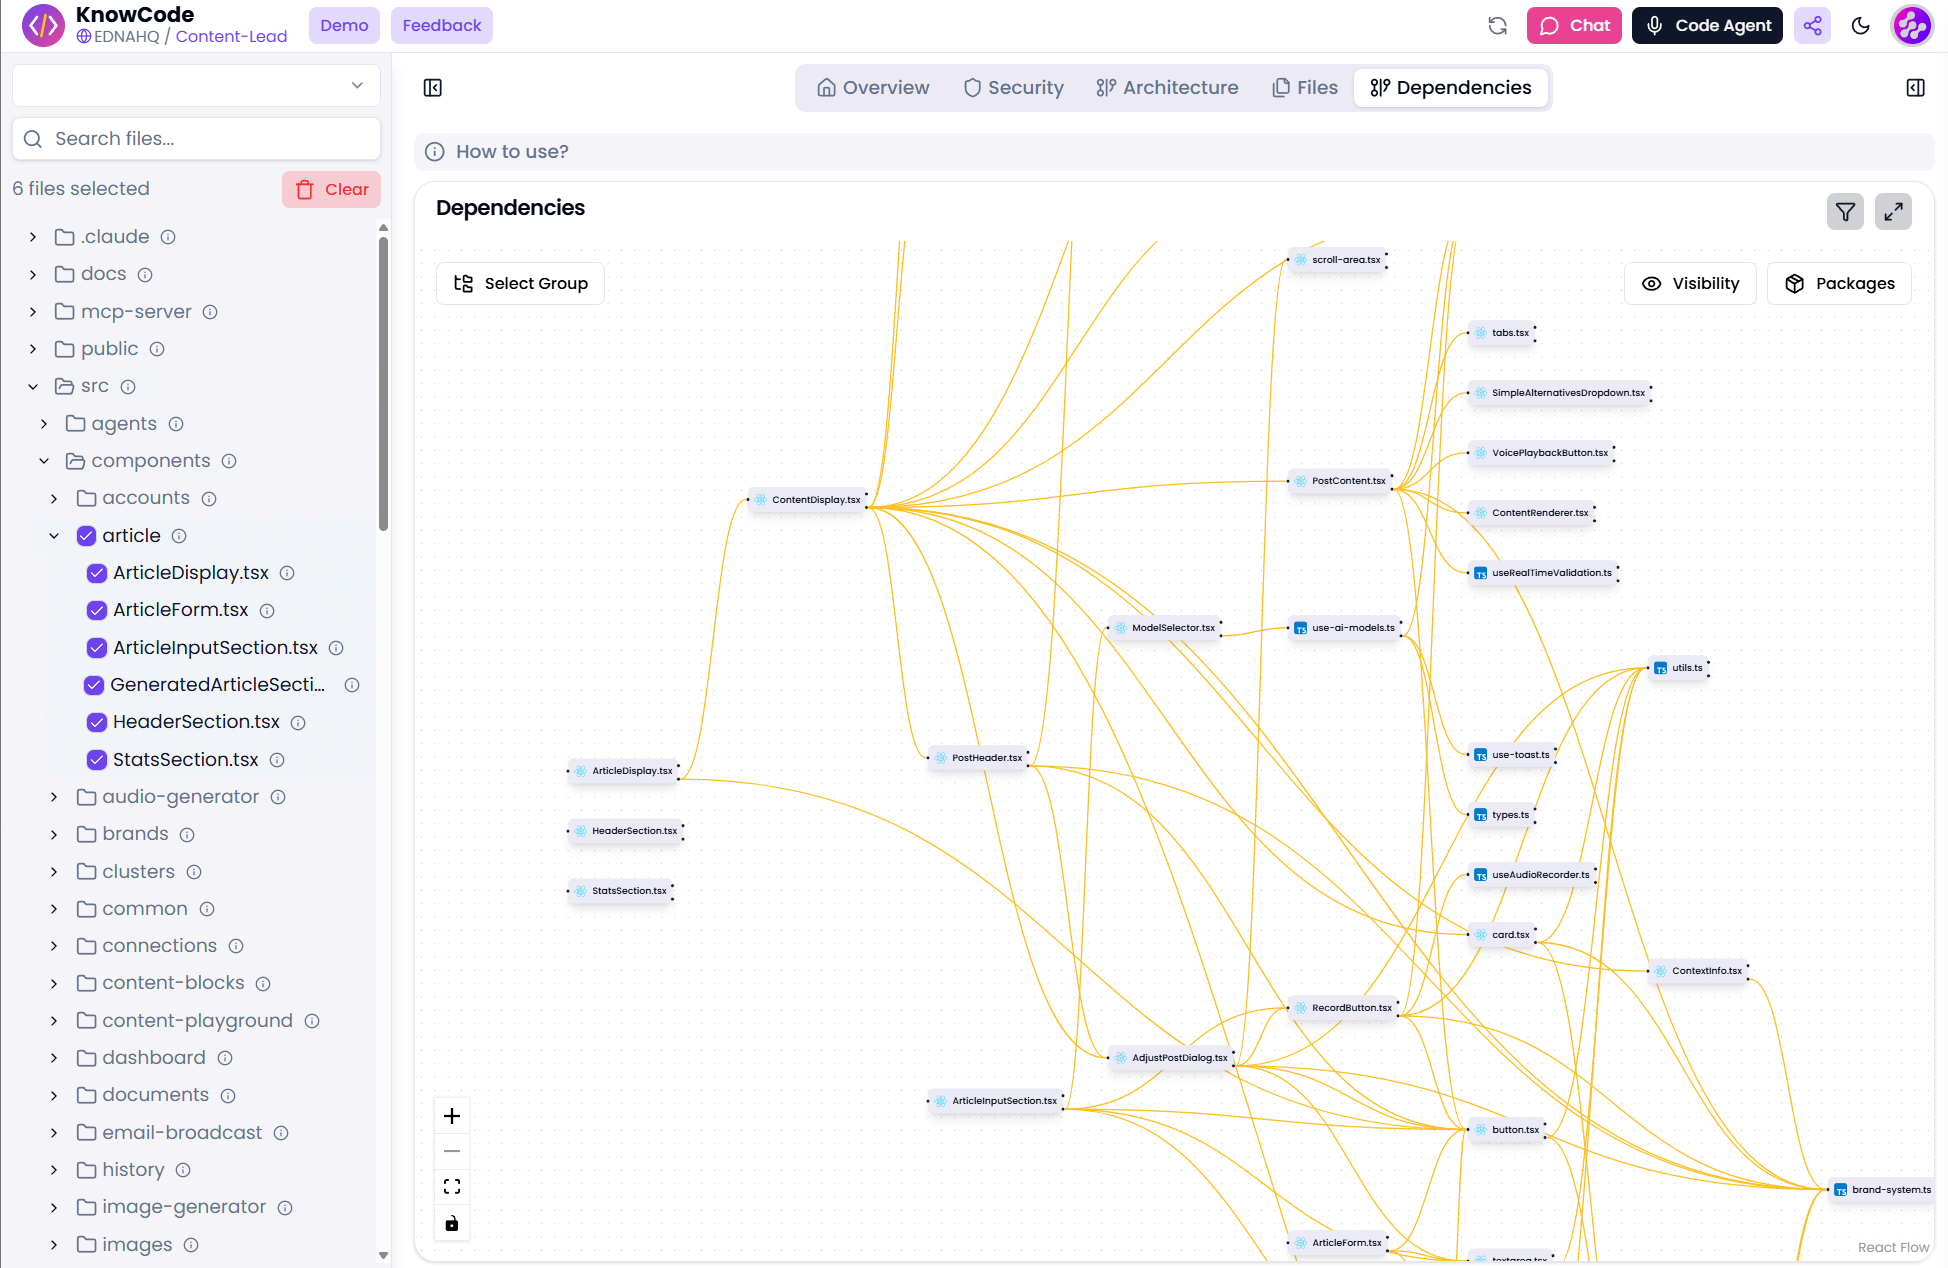
About Code Visualizer
What's this?
Get a visual representation of any piece of code, that shows all the code's relations using the DOT notation.
Can help with understanding your code's structure and relations with ease, using a visual overview.
Usage instructions
Simply paste or upload your code to the textbox below, and Data Mentor will generate a visual representation of your code.